Bitcoin Ducking & Diving Better Than the Rest: Relative Strength in a Risk-Off Market

Risk assets have had a torrid time of late, driven by a somewhat toxic macro cocktail. The S&P 500 has now dipped into official correction territory, dragging down even the most resilient parts of the market — from the high-flying growth names, including the infamous "Mag 7," to industrial commodities like crude oil and copper.
In this environment, you’d normally expect crypto — and in particular, Bitcoin — to be leading the charge lower. Historically, Bitcoin has traded in close correlation with high-beta assets such as the Nasdaq 100. But recently, it’s shown surprising resilience, especially relative to broader equity benchmarks
Bitcoin Technicals – Key Support Zone
Looking at the weekly chart, Bitcoin has pulled back to a key zone of technical support in the $73K–76K area. This region encapsulates multiple confluences:
The 38.2% Fibonacci retracement of the entire rally from the 2022 low
The “point of breakout” from the 2024 rally
The neckline of a much-discussed Inverse Head & Shoulders pattern
If this zone gives way, the technical outlook will darken considerably.
On the topside the key level shows up at 89028.64, which marks the “neckline” to the recent top. If we can move above here and accept above it for a day or two this would open up a run at eh all time highs at 109358.01 and above that the well talked about “Inverse Head & Shoulders” pattern which has a measured objective in the $31k region. .

Bitcoin Spot (source: TradingView Coinbase)
Bitcoin Relative Strength:
Bitcoin vs. Nasdaq 100 (BTCUSD/QQQ)
Since late 2022, Bitcoin has been in a trend of relative outperformance against the Nasdaq 100. The current setup shows a rounding consolidation just below the highs, which — with a bit of imagination — could evolve into the handle of a large "Cup & Handle" pattern.
A breakout and acceptance above the early January highs would confirm this formation and point to further relative outperformance of Bitcoin versus tech equities.
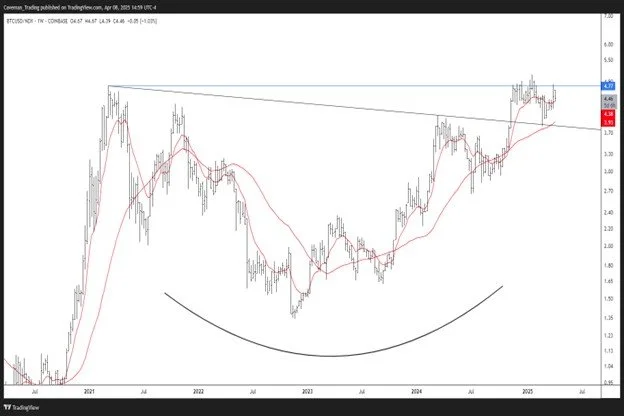
Bitcoin Spot/QQQ (source: TradingView)
Bitcoin vs. Bonds (BTCUSD/$AGG)
While the recent surge in US bond yields/rally in Bonds has triggered a phase of underperformance for Bitcoin on a relative basis, the longer-term trend of outperformance remains intact. Any reversion in yields or stabilization in bond markets could allow Bitcoin to reassert its leadership.
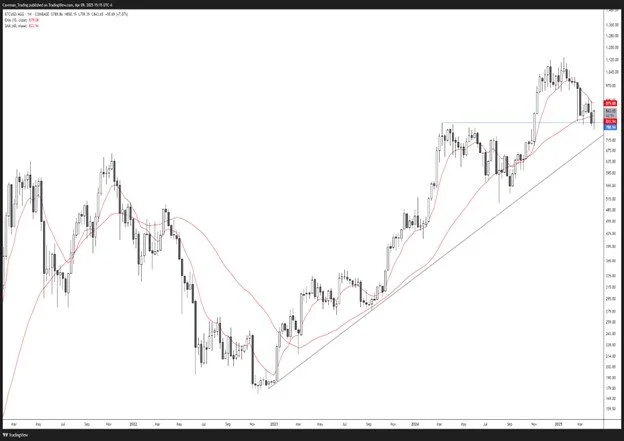
Bitcoin vs Commodities (BTCUSD/$GSG)
Clearly the $GSG ETF is heavily skewed towards energy commodities, but as a broad benchmark for commodities we can see that Bitcoin has shown an overall outperformance similarly since late 2022 and while holding above the rising 200-day SMA, a barometer of long-term trend, further outromance is expected here also.

Bitcoin vs. Gold (BTCUSD/XAUUSD)
Gold has been the standout performer recently, breaking out of its multi-year consolidation in March and entering a strong uptrend. The break of the uptrend line and 200-SMA in the BTC/XAU pair suggests a deeper correction is underway. In the near term, physical gold looks poised to outperform its digital counterpart.
